


pyKrait





End-to-end pipeline for segmenting cells, detecting calcium peaks,
and quantifying oscillation periodicity and spatial synchronicity
from time-lapse microscopy.
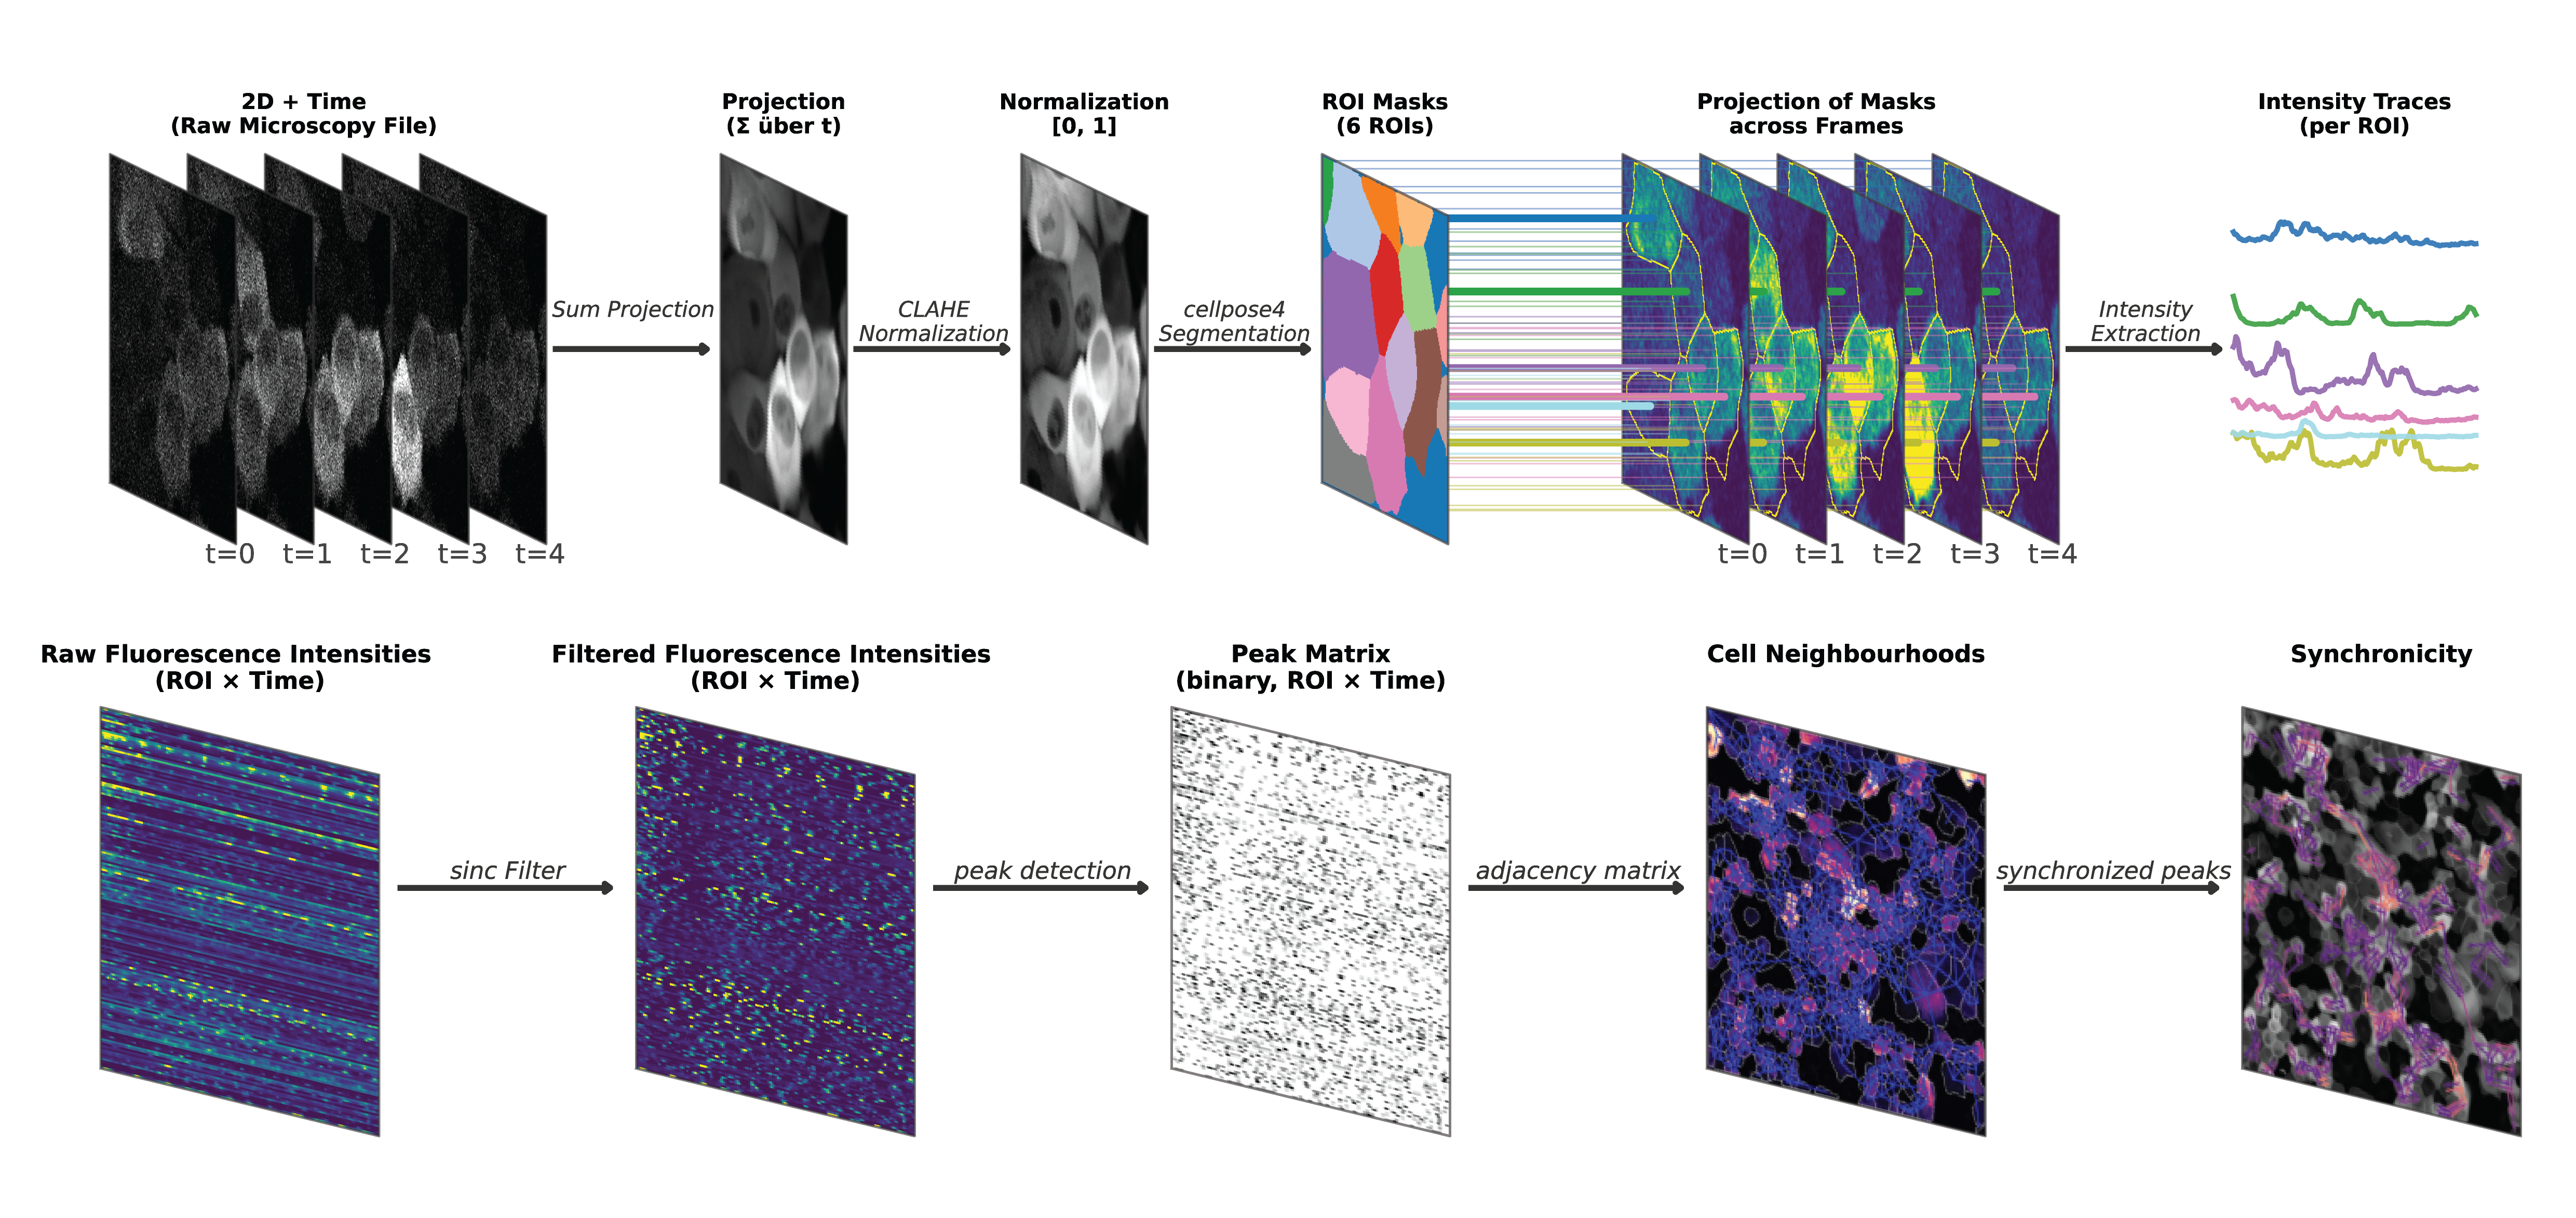
Overview#
pyKrait (python Calcium recording analysis and interpretation toolbox) automatically processes calcium-imaging videos (.czi, .tif, .tiff) and computes calcium activity, peak statistics, periodicity scores, and neighbour-aware synchronicity z-scores.
Installation#
It is recommended to install pyKrait in a virtual environment using either venv or uv. The graphical user interface is optional, install it with pip install "pykrait[gui]".
Using uv#
uv venv --python 3.12
source .venv/bin/activate           # Windows: .venv\Scripts\activate
uv pip install 'pykrait[gui]'
Standard venv#
python -m venv .venv
source .venv/bin/activate           # Windows: .venv\Scripts\activate
pip install --upgrade pip
pip install pykrait
Quickstart#
Launch the GUI#
From inside the activated virtual environment:
python -m pykrait
or
uv run python -m pykrait
The GUI then walks you through video selection, segmentation, peak detection, periodicity, and synchronicity, and lets you save results to disk.
Batch process an entire folder#
from pykrait.pipeline.pipeline import BatchExperiment, AnalysisParameters
from pykrait.io.files import concat_analysis_files

experiment = BatchExperiment(
    folder="/path/to/videos",
    params=AnalysisParameters(),
    extension=".czi",
)
experiment.run()

concat_analysis_files("/path/to/videos", filetype="output")
This produces one Analysis_<video>/ directory per video and an analysis_output_overview.csv at the root of the folder.
Example Notebooks#
Scenario |
Notebook |
|---|---|
Run a folder with custom parameters |
|
Re-run a folder reusing saved parameters and cached masks |
|
Inspect or refine a single video interactively |
Launch the GUI: |
How it works#
For each video, pyKrait runs the following stages:
Load — lazy
Daskarray viabioio(.czi,.tif,.tiff).Project — STD or SUM projection across time, with optional CLAHE.
Segment — Cellpose (
cpsamby default, or a custom model path).Extract — per-cell mean intensity per frame, computed lazily on Dask.
Detrend — Blackman-windowed sinc filter (cf. pyBOAT).
Detect peaks —
scipy.signal.find_peakswith width / height / prominence thresholds.Periodicity — STD and CoV of inter-peak intervals, scored against a shuffled-peaks null.
Adjacency — neighbour graph from segmented masks (kernel-based proximity).
Synchronicity — co-firing peaks within a time window and topological distance, z-scored against label-shuffled controls.
Documentation#
Full API reference and tutorials: https://pykrait.readthedocs.io/en/latest/.
Citation#
If you use pyKrait, please cite the preprint: Hebach, N. R., Olshausen, N., Schlag, J., Mayer, C. D., Henkenjohann, J., Kraft, T., Bang, S., Thommek, C., Nürnberg, C., Horsak, N. E., Hoffmann, D. C., Kourtesakis, A., Porzberg, N., Flores Valle, A., Linke, C. Z., Yang, Y., Azorín, D. D., Hausmann, D., Venkataramani, V., … Karreman, M. A. (2026). Collective cancer cell calcium activity drives brain metastasis. bioRxiv, 2026.05.10.723715. https://doi.org/10.64898/2026.05.10.723715
Acknowledgements#
pyKrait builds on and heavily uses prior open-source work: