
pyKrait





End-to-end pipeline for segmenting cells, detecting calcium peaks,
and quantifying oscillation periodicity and spatial synchronicity
from time-lapse microscopy.
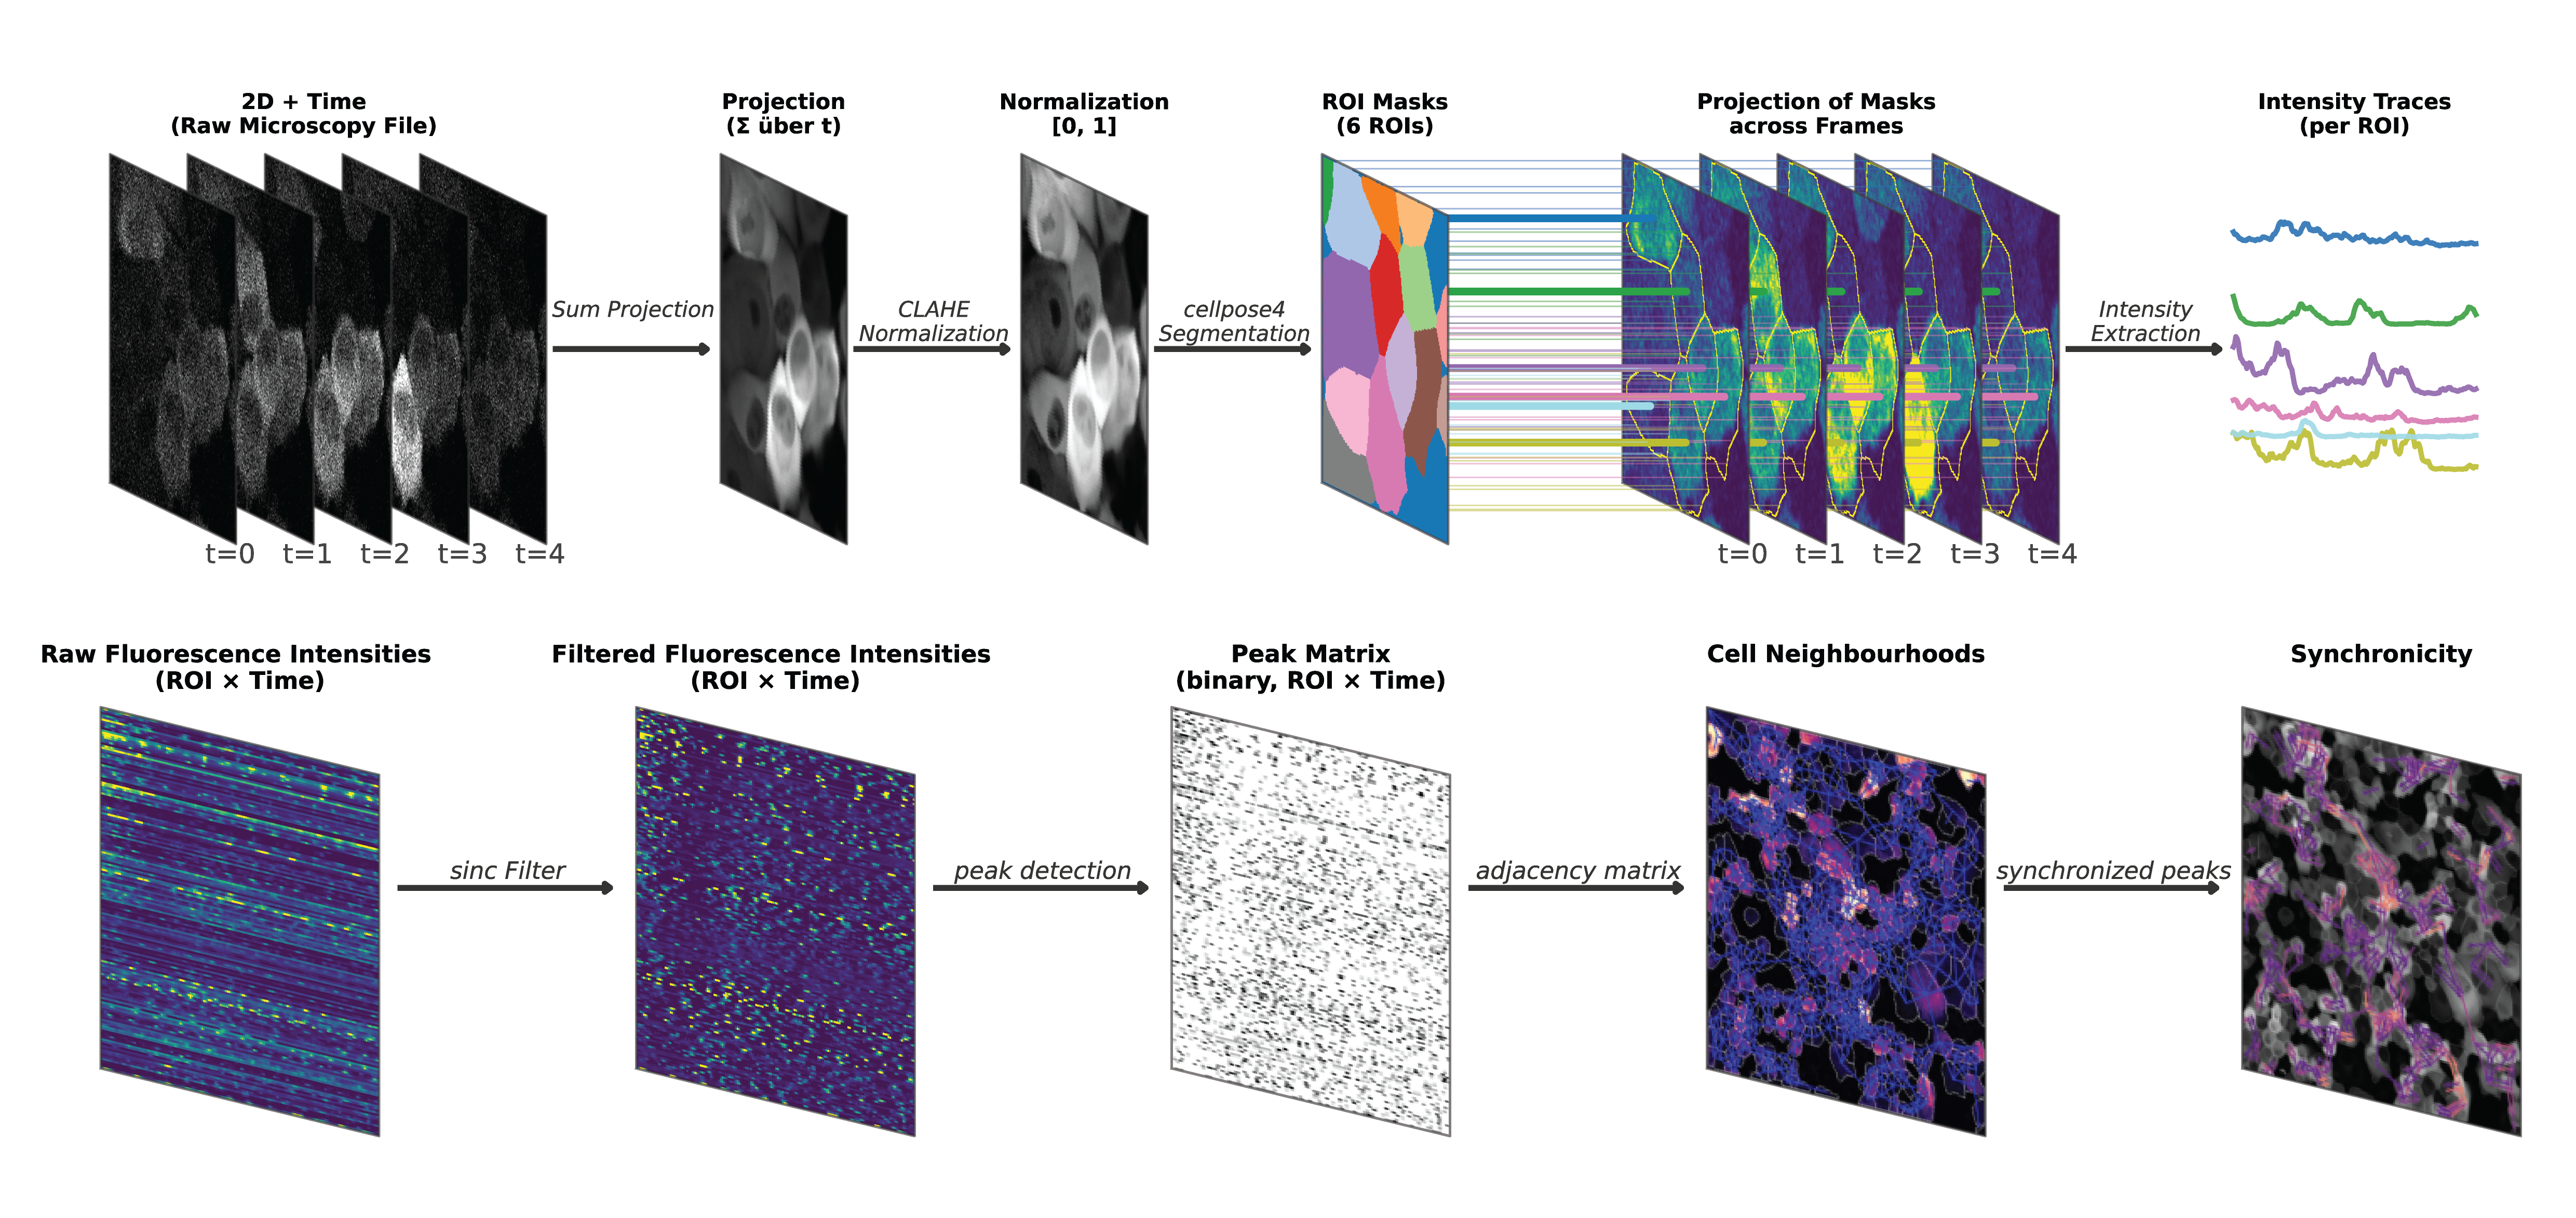
## Overview
pyKrait (**py**thon **C**alcium **r**ecording **a**nalysis and **i**nterpretation **t**oolbox) automatically processes calcium-imaging videos (.czi, .tif, .tiff) and computes calcium activity, peak statistics, periodicity scores, and neighbour-aware synchronicity z-scores.
## Installation
It is recommended to install pyKrait in a virtual environment using either venv or uv. The graphical user interface is optional, install it with `pip install "pykrait[gui]"`.
### Using `uv`
```bash
uv venv --python 3.12
source .venv/bin/activate # Windows: .venv\Scripts\activate
uv pip install 'pykrait[gui]'
```
### Standard `venv`
```bash
python -m venv .venv
source .venv/bin/activate # Windows: .venv\Scripts\activate
pip install --upgrade pip
pip install pykrait
```
## Quickstart
### Launch the GUI
From inside the activated virtual environment:
```bash
python -m pykrait
```
or
```bash
uv run python -m pykrait
```
The GUI then walks you through video selection, segmentation, peak detection, periodicity, and synchronicity, and lets you save results to disk.
### Batch process an entire folder
```python
from pykrait.pipeline.pipeline import BatchExperiment, AnalysisParameters
from pykrait.io.files import concat_analysis_files
experiment = BatchExperiment(
folder="/path/to/videos",
params=AnalysisParameters(),
extension=".czi",
)
experiment.run()
concat_analysis_files("/path/to/videos", filetype="output")
```
This produces one `Analysis_